Here’s some interesting news: a recent Teradata study showed a huge correlation between a company’s tendency to rely on data when making decisions, and its profitability and ability to innovate. According to the study, data-driven companies are more likely to generate higher profits than competitors who report a low reliance on data. Access to data and quantitative tools that convert numbers to insights are two to three times more common in data-centric companies – as well as being much more likely to reap the benefits of data initiatives, from increased information sharing, to greater collaboration, to better quality and speed of execution.
Today Big Data is a big boon for the IT industry; organizations that gather significant data are finding new ways to monetize it, while the companies that deliver the most creative and meaningful ways to display the results of Big Data analytics are lauded, coveted, and sought after. But for certain, Big Data is NOT some magic panacea that, when liberally applied to a business, creates giant fruiting trees of money.
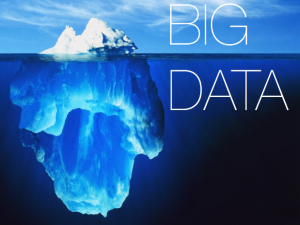
First let’s take a look at some figures that illustrate how BIG “Big Data” is.
– A few hundred digital cameras together have enough combined memory to store the contents of every printed book in the Library of Congress.
– Just 10 minutes of world email content is, again, the contents of every printed book in the Library of Congress. Thats equal to 144x the contents of the Library of Congress every day.
– Every day, we create 2.5 quintillion bytes of data — so much that 90% of the data in the world today has been created in the last two years alone.
– Only 3% of potentially useful data is tagged, and even less is analyzed.
– In 2010 there was 1 trillion gigabytes of data on the Internet; that number being predicted to double each year, reaching 40 trillion gigabytes by the year 2020.
The sheer size of large datasets force us to come up with new methods for analysis, and as more and more data is collected, more and more challenges and opportunites will arise.
With that in mind, lets examine, 6 things to keep in mind when considering Big Data.
1. Data analytics gives you AN answer, not THE answer.
In general, data analysis cannot make perfect predictions; instead, it might make predictions better than someone usually could without it. Also, unlike math, data analytics does not get rid of all the messiness of the dataset. There is always more than one answer. You can glean insights from any system that processes data and outputs an answer, but it’s not the only answer.
2. Data analytics involves YOUR intuition as a data analyst.
If your method is unsound, then the answer will be wrong. In fact, the full potential of quantitative analytics can be unlocked only when combined with sound business intuition. Mike Flowers, chief analytics officer for New York City under Mayor Bloomberg, explained the fallacy behind either-or thinking as such: “Intuition versus analytics is not a binary choice. I think expert intuition is the major missing component of all the chatter out there about analytics and being data driven.”
3. There is no single best tool or method to analyze data.
There are two general kinds of data, however not all analytics will necessarily include both, and as you might expect, they need to be analyzed differently.
Quantitative data refer to the information that is collected as, or can be translated into, numbers, which can then be displayed and analyzed mathematically. It can be processed using statistical methods such as calculating the mean or average number of times an event or behavior occurs over a unit of time.
Because numbers are “hard data” and not subject to interpretation, these methods can give nearly definitive answers to different questions. Various kinds of quantitative analysis can indicate changes in a dependent variable related to frequency, duration,intensity, timeline, or level, for example. They allow you to compare those changes to one another, to changes in another variable, or to changes in another population. They might be able to tell you, at a particular degree of reliability, whether those changes are likely to have been caused by your intervention or program, or by another factor, known or unknown. And they can identify relationships among different variables, which may or may not mean that one causes another. http://ctb.ku.edu/en/table-of-contents/evaluate/evaluate-community-interventions/collect-analyze-data/main
Qualitative data are items such as descriptions, anecdotes, opinions, quotes, interpretations, etc., and are generally either not able to be reduced to numbers, or are considered more valuable or informative if left as narratives. Qualitative data can sometimes tell you things that quantitative data can’t., such as why certain methods are working or not working, whether part of what you’re doing conflicts with participants’ culture, what participants see as important, etc. It may also show you patterns – in behavior, physical or social environment, or other factors – that the numbers in your quantitative data don’t, and occasionally even identify variables that researchers weren’t aware of. There are several different methods that can be used when analyzing qualitative data:
Content Analysis: In general, start with some ideas about hypotheses or themes that might emerge, and look for them in the data that you have collected.
Grounded Analysis: Similar to content analysis in that it uses similar techniques for coding, however you do not start from a defined point. Instead, you allow the data to ‘speak for itself’, with themes emerging from the discussions and conversations.
Social Network Analysis: Examines the links between individuals as a way of understanding what motivates behavior.
Discourse Analysis: Which not only analyses conversation, but also takes into account the social context in which the conversation occurs, including previous conversations, power relationships and the concept of individual identity.
Narrative Analysis: Looks at the way in which stories are told within an organization, in order to better understand the ways in which people think and are organized within groups.
Conversation Analysis: Is largely used in ethnographic research, and assumes that conversations are all governed by rules and patterns which remain the same, whoever is talking. It also assumes that what is said can only be understood by looking at what happened both before and after.
Sometimes you may wish to use one single method, and sometimes you may want to use several, whether all one type or a mixture of Quantitative or Qualitative data. Remember to have a goal or a question you want to answer – once you know what you are trying to learn, you can often come up with a creative way to use the data. It is your research, and only you can decide which methods will suit both your questions and the data itself. Quicktip: Make sure that the method that you use is consistent with the philosophical view that underpins your research, and within the limits of the resources available to you.
4. You do not always have the data you need in the way that you need it.
In a 2014 Teradata study, 42% of respondents said they find access to data cumbersome and not user-friendly. You might have the data, but format is KEY: it might be rife with errors, incomplete, or composed of different datasets that have to be merged. When working with particularly large datasets, oftentimes the greatest timesink – and the biggest challenge – is getting it into the form you need.
5. Not all data is equally available.
Sure, some data may exist free and easy on the Web, but more often than not, the sheer volume, velocity, or variety prevents an easy grab. Furthermore, unless there is an existing API or a vendor makes it easily accessible by some other means, you will ultimately need to write a script or even complex code to get the data the way you want it.
6. While an insight or approach adds value, it may not add enough value.
In Broken Links: Why analytics investments have yet to pay off, from the Economist Intelligence Unit (EIU) and global sales and marketing firm ZS, found that although 70% of business executives rated sales and marketing analytics as “very” or “extremely important”, just 2% are ready to say they have achieved “broad, positive impact.”
In 2013, The Wall Street Journal reported that 44% of information technology professionals said they had worked on big-data initiatives that got scrapped. A major reason for so many false starts is that data is being collected merely in the hope that it turns out to be useful once analyzed. This type of behavior is putting the cart before the horse, and can be disastrous to businesses – again, remember to have a goal or question you want to answer.
Not every new insight is worth the time or effort to integrate it into existing systems. No insight is totally new. If every insight is new, then something is wrong.
Hopefully these tips will set you off in the right direction when you are considering to incorporate additional datasets and their associated analytics platforms into your business process. Good Luck!


